Clay Flood Concepts
See How Extreme Flooding Could Affect Your Property
High-resolution terrain and flood visualizations prepared for Texas landowners.
Order Your Flood SnapshotWe model extreme rainfall events to show what could actually happen on your land.
We ask the question, what if a storm similar to the July 4, 2025 storm happened in your area? We simulate how a similar event could behave in your watershed.
What happens if 20 ± inches falls over night?
How deep does water get on your property?
How far does it spread?
How fast does move?
View sample maps : Depth and Speed
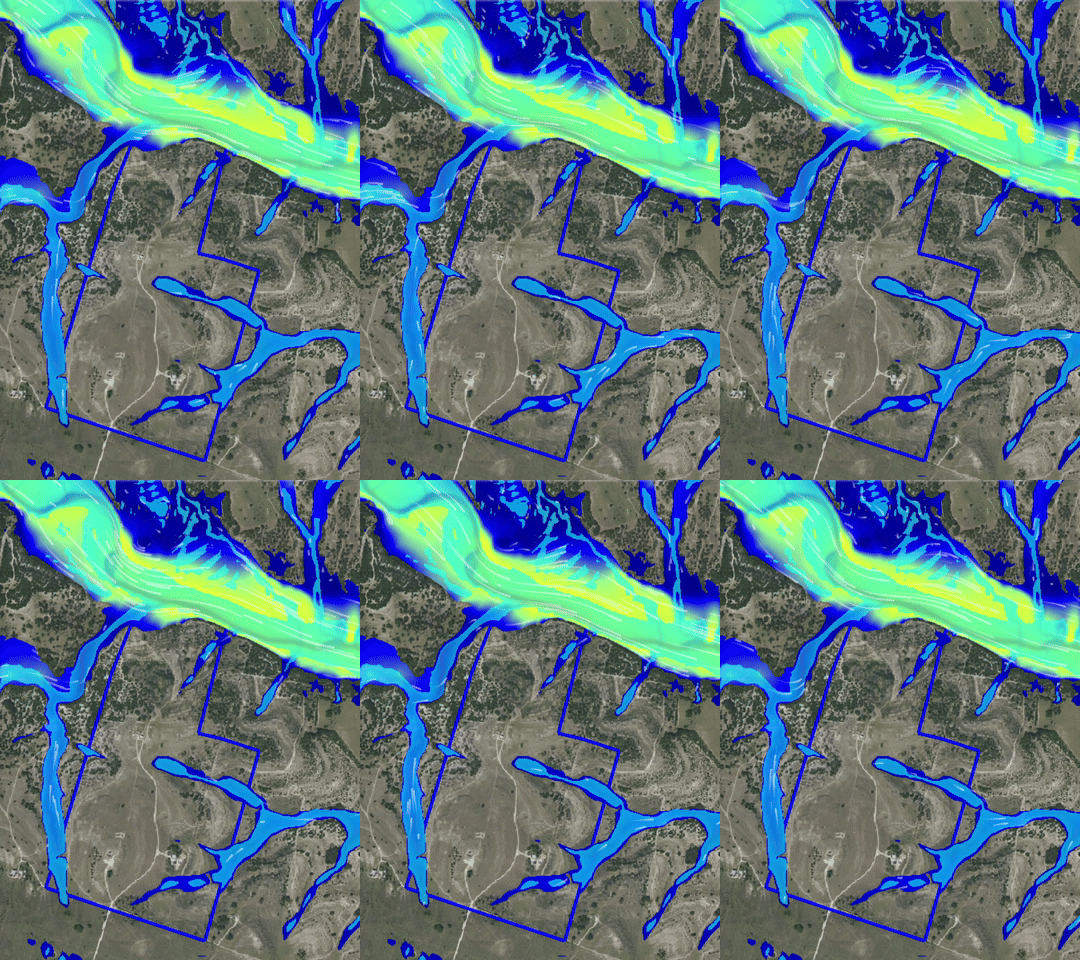
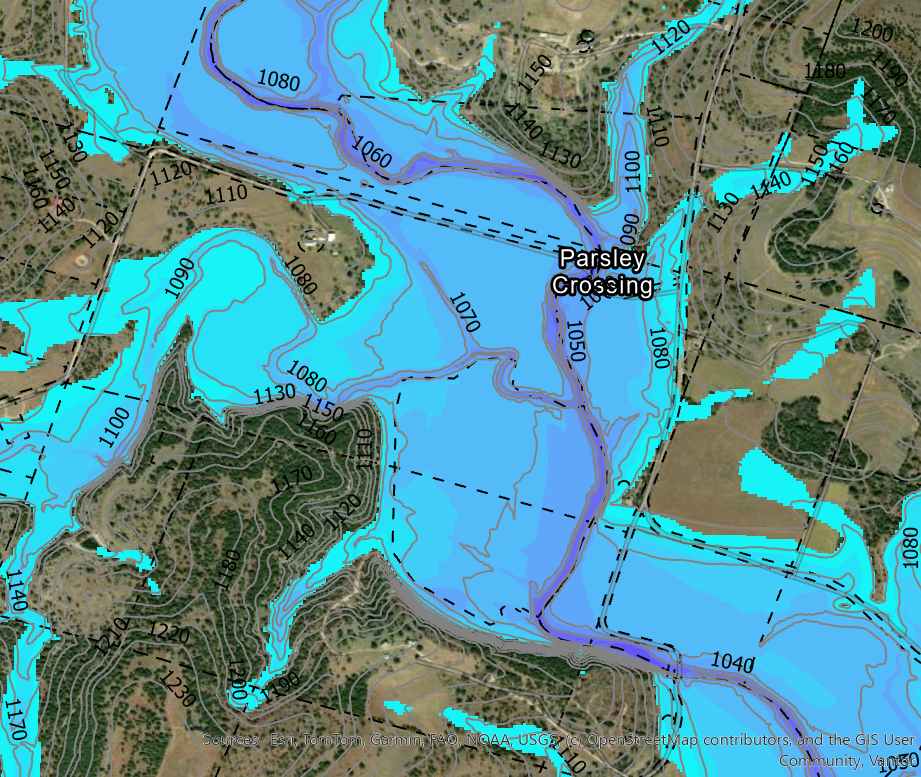
Sample Custom Animation - this is the flood depth the duration of an extreme rainfall. The legend on the right indicates the depth!
The Problem and Solution
Flood maps you’ve seen before are typically built for insurance and regulation and public infrastructure. Nothing wrong with that, but what about those not in the study area? Clay Flood Concepts explores additional hypothetical extreme-events storm scenarios intended for public awareness and visualization.
In Central Texas, extreme rainfall can drop 10–20+ inches in just a few hours.
Water rises fast. It moves fast. And it doesn’t care what zone you’re in.
By the time you see it, it’s already too late.
Whats Currently Available ?
Floodplain Maps - The standard.
These are the baseline for insurance and public infrastructure. While this is important, they don’t typically show extreme storm events. Our maps dont replace FEMA, they just show something beyond it.
Getting your own engineering study could cost tens of thousands of dollars!
Traditional Flood Maps
Based on the “100-year storm”
Static and generalized
Some maps don’t provide depth.
Do not show velocity or real-time behavior
Clay Flood Concepts
Based on hypothetical extreme scenarios - I run a conceptual hydrograph of extreme rainfall precipitation over your watershed - from the upper bounds to your property. It can vary from 10” to 20” depending on the watershed in just a few hours.
Customized visualizations for your property area based on available parcel data from the County or State.
Concepts of depth and speed.
Designed for awareness — not paperwork.
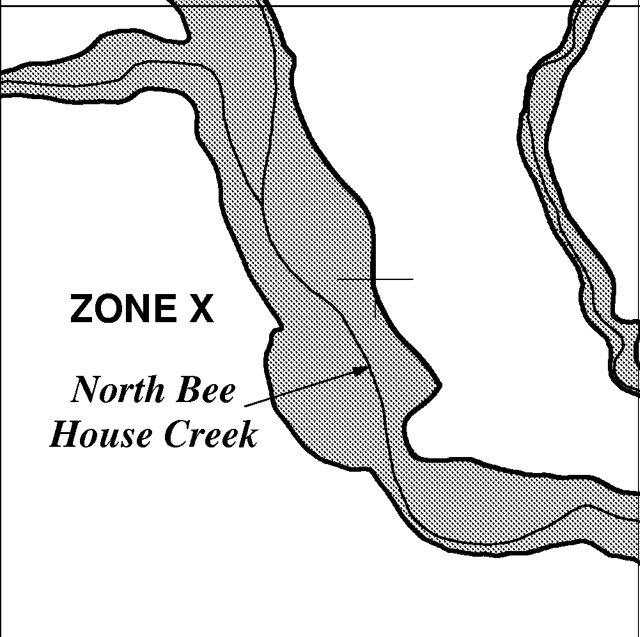
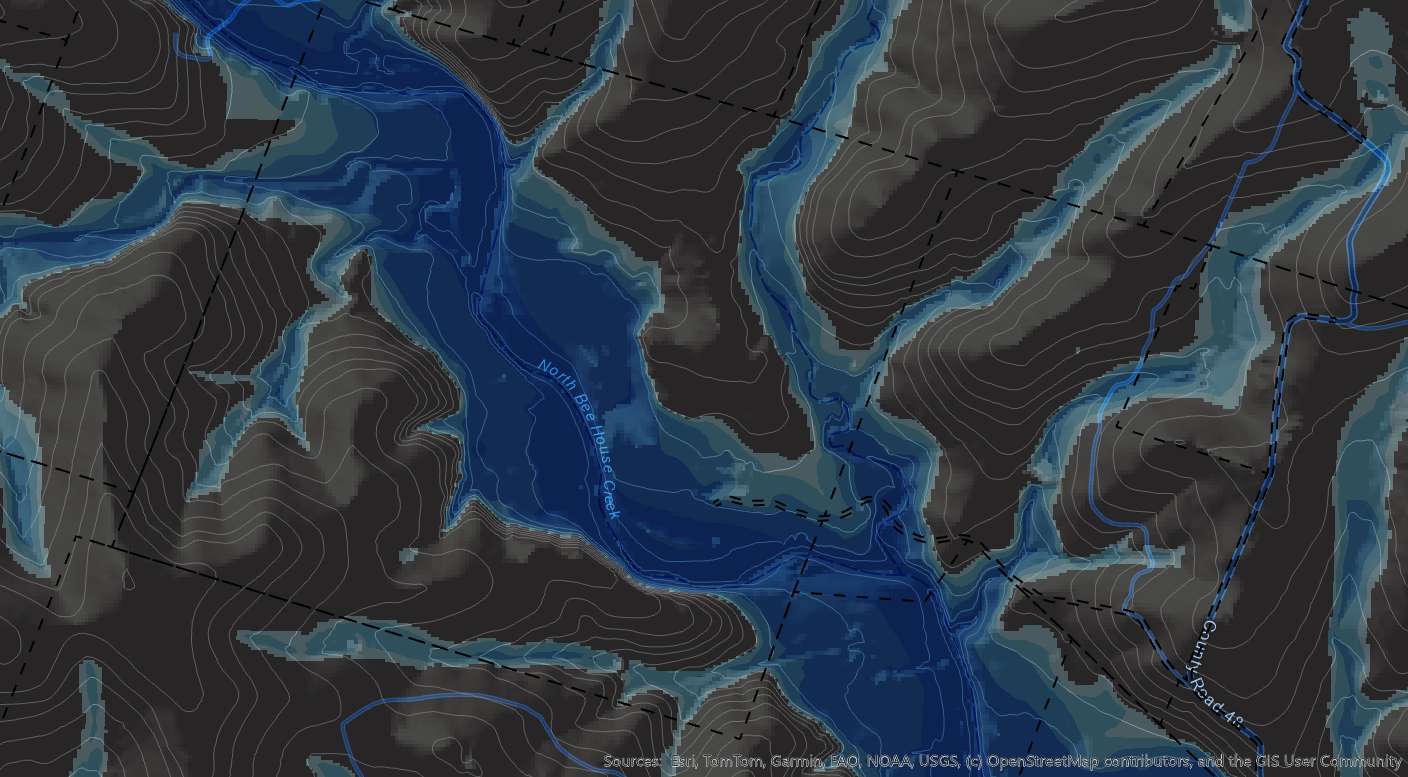
Floodplain Map
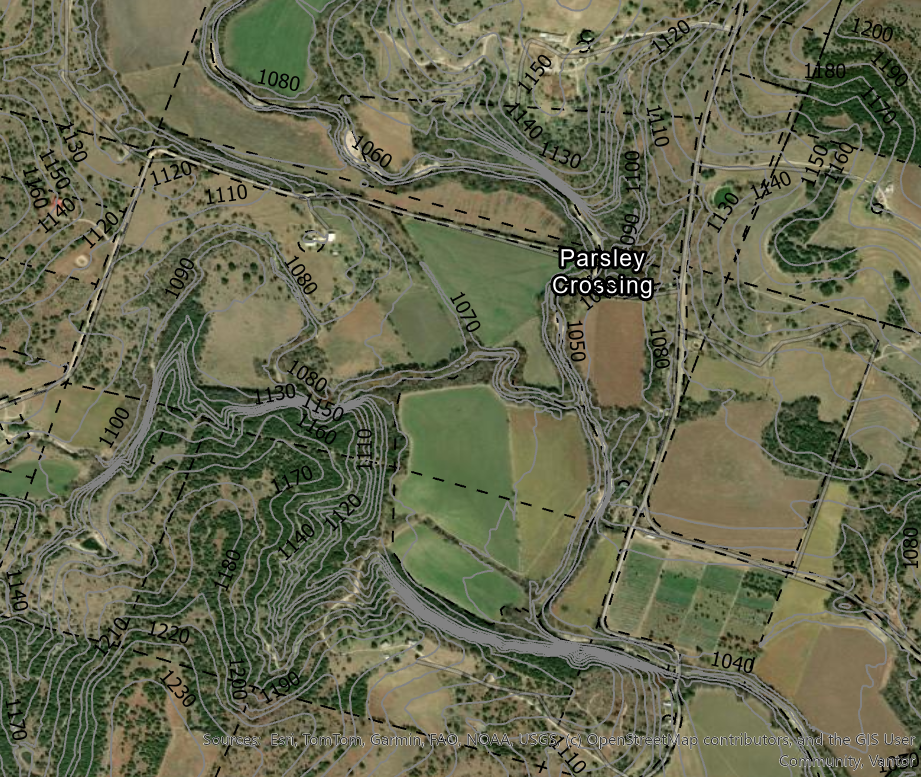
Before and After (move the slider)
What You Get
Visualize potential flood behavior before it happens - click the buttons for samples.
Why We Exist
On July 4th, a wall of water came down the Guadalupe River. We were trapped in our house. The wave of flood water took the house with us inside downstream half a mile before breaking apart and throwing us all in the black, raging river.
We didn’t have a warning.
We didn’t know what was coming.
We barely survived and we lost our son, Clay.
This company exists so others don’t face the unknown the way we did.
Here is our story in more detail: https://www.texasmonthly.com/news-politics/texas-flood-firsthand-account/
I am a licensed Professional Engineer in Texas with over 20 years of experience. Utilizing my skills, I am making these studies and maps to help out society.